Example - CSV Data
CSV as a Table
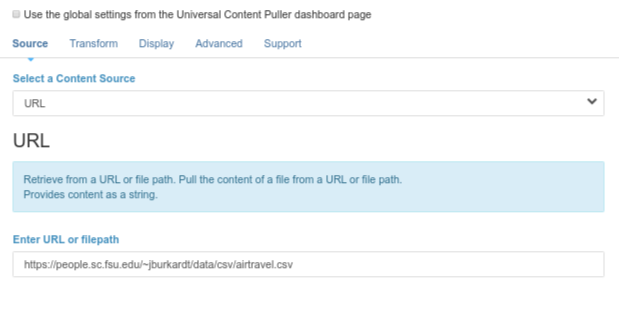
You have some CSV files you would like to show as tables. For a content source, you can either pull the file as a URL or file path using the URL source, or upload the file to the Concrete CMS File Manager and pull from the there using the File source.
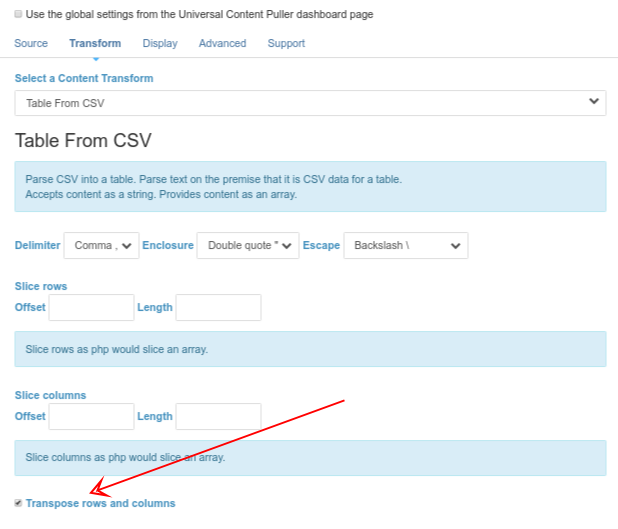
The choice of Content Transform is CSV.
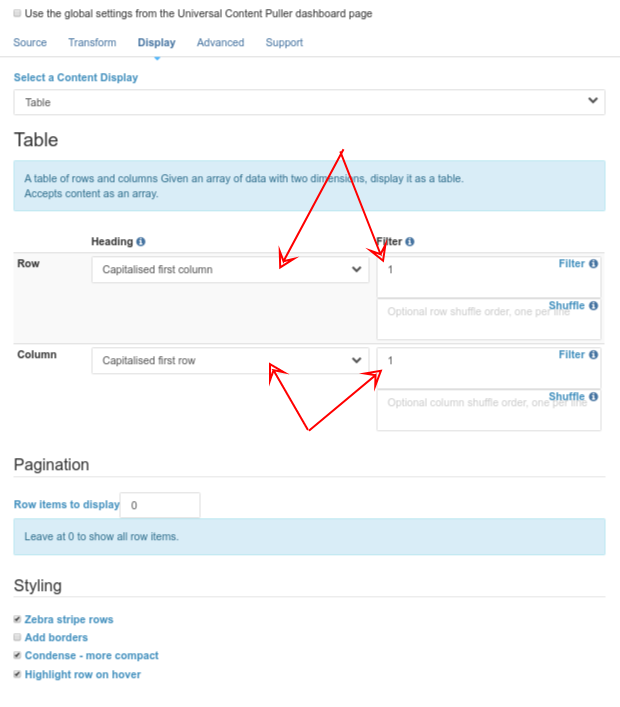
Content Display will usually be Table because that is optimised for tabular display, though you may also want to consider Multi Level List which also has table output capabilities.
If the CSV contains more rows or columns than you want, the CSV transform can slice it by rows and or columns. You may need to adjust the csv options in the transform if the source does not followm the usual conventions. Finally, you may also want to transpose it, rotating rows and columns.
In the Table display dialog you can select what to use for row and column headings and filter out rows or columns you don't want to actually display. For example, if you are using the first row for column headings, you will aslo want to filter that row from the table body.
If you run into difficulties with the transformed csv data, the Serialize content display can be used to display the raw data as a php dump or as JSON.
If its a big table, it can optionally be paginated using the pagination settings in the Table dialog.
airtravel.csv
Here we pull a table of ancient air travel stats by month from the example csv at the URL https://people.sc.fsu.edu/~jburkardt/data/csv/airtravel.csv. In the real world we would accompany the table with some explanatory text about the data, but we don't want to confuse things here. We are only interested in it as an example, not in its meaning!
To get the months across the page, the rows and columns have been transposed in the content transform. The first row and first column are used as headings and also filtered from the body of the table.
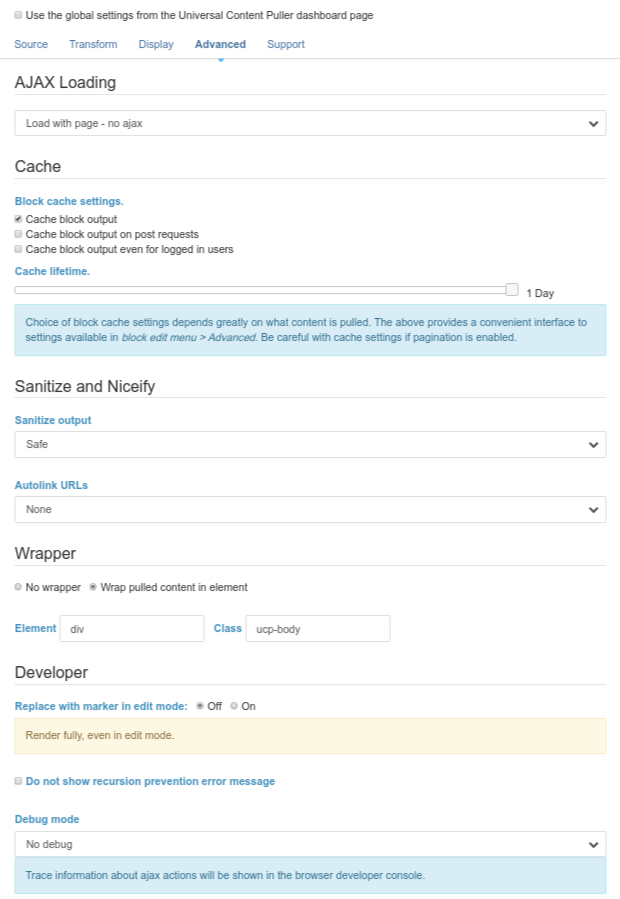
Finally, as the data is static the block cache is set until manually cleared.
You can see this same table of data as a chart using Universal Content Puller Charts.
| Jan | Feb | Mar | Apr | May | Jun | Jul | Aug | Sep | Oct | Nov | Dec | |
|---|---|---|---|---|---|---|---|---|---|---|---|---|
| 1958 | 340 | 318 | 362 | 348 | 363 | 435 | 491 | 505 | 404 | 359 | 310 | 337 |
| 1959 | 360 | 342 | 406 | 396 | 420 | 472 | 548 | 559 | 463 | 407 | 362 | 405 |
| 1960 | 417 | 391 | 419 | 461 | 472 | 535 | 622 | 606 | 508 | 461 | 390 | 432 |
The unprocessed source
For comparison, the NL2BR transform is used with the Plain display to show the unprocessed csv.
"JAN", 340, 360, 417
"FEB", 318, 342, 391
"MAR", 362, 406, 419
"APR", 348, 396, 461
"MAY", 363, 420, 472
"JUN", 435, 472, 535
"JUL", 491, 548, 622
"AUG", 505, 559, 606
"SEP", 404, 463, 508
"OCT", 359, 407, 461
"NOV", 310, 362, 390
"DEC", 337, 405, 432
CSV as a Multi Level List
While we have the csv data, here is the same data displayed using the Multi Level List content display. The source and transform are the same as for the table above.
The outer list is paragraphs, with the first child value as the heading and the first item filtered. The inner list is a horizontal definition list, again with the first item filtered.
1958
- Jan
- 340
- Feb
- 318
- Mar
- 362
- Apr
- 348
- May
- 363
- Jun
- 435
- Jul
- 491
- Aug
- 505
- Sep
- 404
- Oct
- 359
- Nov
- 310
- Dec
- 337
1959
- Jan
- 360
- Feb
- 342
- Mar
- 406
- Apr
- 396
- May
- 420
- Jun
- 472
- Jul
- 548
- Aug
- 559
- Sep
- 463
- Oct
- 407
- Nov
- 362
- Dec
- 405
1960
- Jan
- 417
- Feb
- 391
- Mar
- 419
- Apr
- 461
- May
- 472
- Jun
- 535
- Jul
- 622
- Aug
- 606
- Sep
- 508
- Oct
- 461
- Nov
- 390
- Dec
- 432
CSV Embedded as JSON Data
Here is a trick for developers. Suppose you have some data you need to provide for your own JavaScript code to work with or display.
Rather than display the processed data, the JavaScript Data display plugin can be used to embed it as JSON, either assigned to a global object, or in this case embedded in an HTML data attribute. Other options for naming (adding headings to) data items and filtering are the same as in the Multi Level List.
So you can easily view what is going on, the Debug setting is enabled in the Advanced tab. This dumps the embedded JSON data to the browser developer console.
Open your browser Developer Console and have a look...


